Which Reports Indicate How Traffic Arrived At A Website?
Question: Which reports indicate how traffic arrived at a website?
Options:
- Demographics
- Geo
- All Traffic ✅
- Behavior
Answer: 3. All Traffic
Explanation: Which Reports Indicate How Traffic Arrived At A Website?
There are various reports that indicate how traffic arrived at your website. However, to ascertain each kind of traffic, you can view all the traffic reports in Google Analytics. To view reports that indicate how traffic arrived at your website, you can open a Google Analytics report and then go to the “Acquisition” tab on the left. Here, you will find another option called “All Traffic.” You can click on this option to learn about how traffic at your website.
Types Of All Traffic Reports
The various types of traffic reports are:
1. Landing Pages Report

Landing Pages reports are one of the most important reports to learn how traffic arrives at your website. You can view this report by following this path:
Behavior >Site Content >Landing Page
This report offers you a description of the pages on your website that users are most interested in visiting and divides the data into visitor counts and time periods like a day or a month. It is helpful since it demonstrates the following:
- Pages per visit: The count of pages visited after the landing page.
- Average Visit Duration: Time visitors spend on your site.
- Percentage of New Visitors: Visitors visiting your page for the first time.
- Bounce Rate: Visitors who exited your site after the landing page.
2. Referrals Report
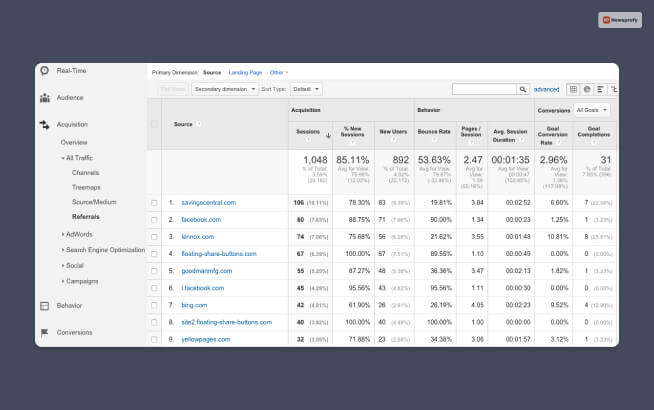
The top websites that referred visitors to your website are included in this report. Search engines, blogs, social networking platforms, newsletters, and other websites can all serve as referrers. Click on the link that appears next to the name of each referrer to find out more about each of these sources.
By selecting the Referrals tab, you can also opt to view your entire referral traffic. The number of visitors from all referring domains is shown in this section. Any domain name may be clicked to open a page with extensive information on the visitor.
3. Active Users Report
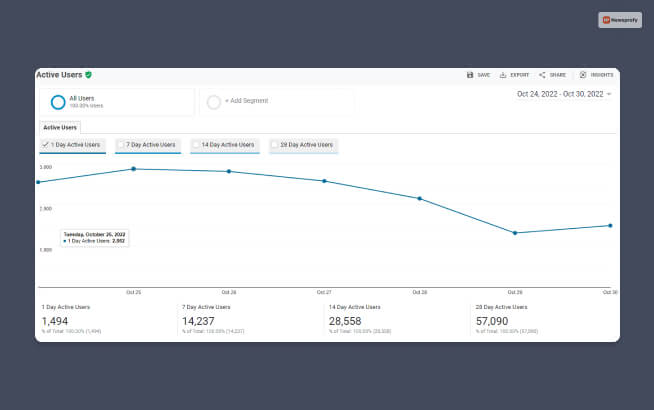
This report shows people that visited your website based on a certain time period, such as daily, weekly, bimonthly, or monthly. This will be according to Google Analytics IQ. Analyzing the website or mobile app’s retention rate is beneficial.
4. Real-Time Report

This report shows each hit on your website as it happens at the same time you are viewing the report.
5. Frequency Report
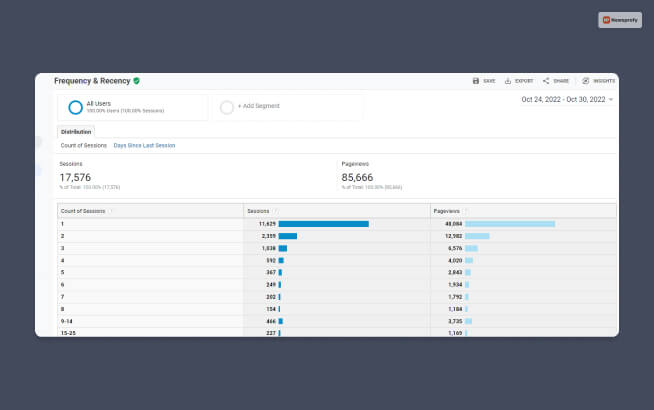
This section of this often-used report maintains track of how many sessions there have been in relation to its frequency. The day since the last recorded session is determined by the recency. Here, the latest segments can be made based on frequency and recentness. Segments in Google Analytics are audience categories that let you examine how various users engage with your web pages. The segments aid in streamlining your lead creation process.
6. Engagement Report
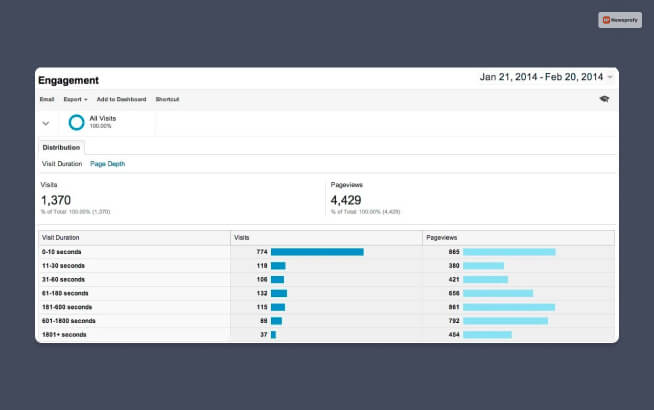
You may view the pages and screens that have the most user involvement by using Google Analytics’ Engagement Report. You may also utilize events to learn more about user behavior.
7. New vs Returning Report
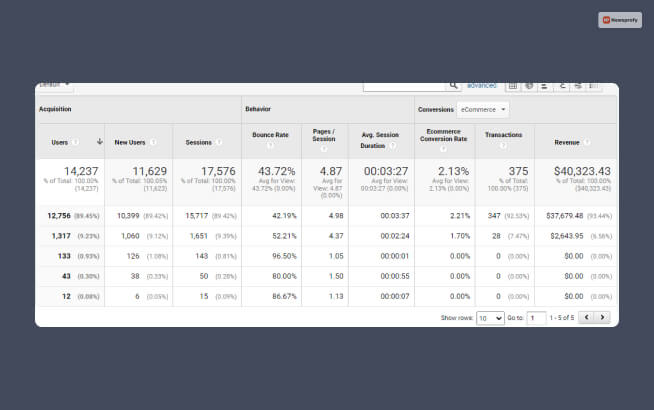
There are typically two categories of visitors: those who are coming to your website for the very first time, including those who are returning. Google Analytics makes use of the distinction to comprehend website visitors.
8. Multi-Channel Funnel Report

Through the time lag report and channel interactions, this report aids in the analysis of the conversion process. This conversion funnel displays default conversions and contains conversion touchpoints.
9. Network Report
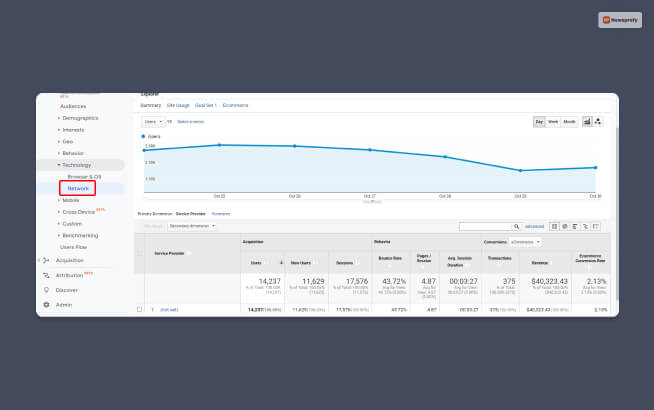
Google Analytics reports, called network reports, capture all of the traffic coming from a specific domain. If you have access to the domain’s Google Analytics reports, you may also use it to monitor visits from every website in a network, including subdomains.
10. Campaign Report

Google Analytics campaign reports are a fantastic feature. They enable you to gather information about your campaigns’ performance in one location so that you may improve their efficiency. The Google Analytics campaign reports are a fantastic tool for evaluating the success of your marketing initiatives. By campaign name, they provide you with your conversion metrics and other statistics.
11. Goal Flow Report
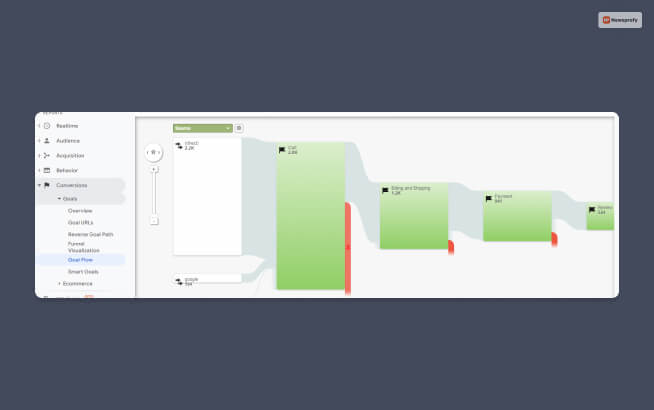
This report shows the path the visitors took through the funnel to reach Goal Conversion. It answers questions like:
- Did users start from the first landing page, or did they directly go to a specific page?
- How many times did visitors exit while scrolling through a page?
- Did the traffic loop back to the landing page from other pages?
- How did visitors of a specific segment enter the landing page?
12. Custom Reports
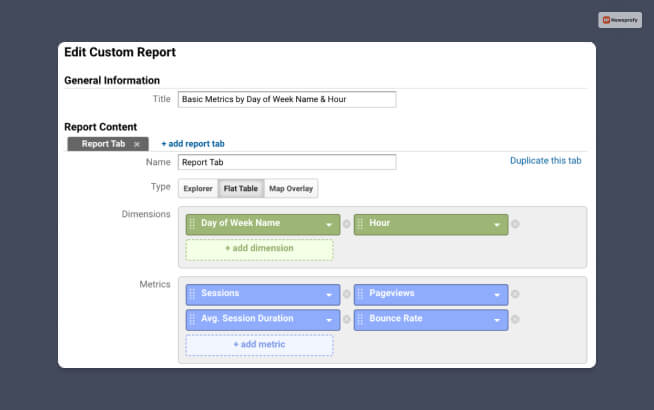
A bespoke report is one that you may construct by choosing the dimensions, metrics, and presentation style. You must choose at least one statistic (such as Session, Page Views, or Bounce Rate) and one dimension (such as city or browser).
How To View The All Traffic Report In Google Analytics?

Google Analytics has seven types of reports divided into three broader categories as Audience, Acquisition, and Behavior. The All Traffic report comes under the Acquisition section.
- Log in to your Google Analytics account.
- At the left side of the page, click on Acquisition.
- Finally, lick on All Traffic Report.
FAQs(Frequently Asked Questions)?
Many Google Analytics users and learners have asked questions regarding which reports indicate how traffic arrived at a website. Some of the answers to such questions are:
Ans – The landing pages report indicates which page the users first enter when they visit your website.
Ans – All traffic reports in Google Analytics show how traffic arrives at various pages of a website and from which geo-location in the world.
Ans – There is a report on Google Analytics called All Pages Report. This indicates which web pages on your website are getting the most traffic.
Ans – If you see the site search report, it will show what pages users visit the most. Therefore, you can assess what type of content on your website is most preferred by users.
Conclusion
In Google Analytics, “Referrals” is where all of the domains that deliver visitors to your website are listed. Under the “Acquisition” tab, under “All Traffic,” you may access “Referrals.”
This report offers you an overview of the pages on your website that users are most interested in visiting and divides the data into visitor counts and time periods like a day, week, or month. It is helpful since it demonstrates the following:
READ MORE:


